Mocha Analytics pulls Shopify, GA4, Klaviyo, and ad platform data into one dashboard and tells you what changed every morning.
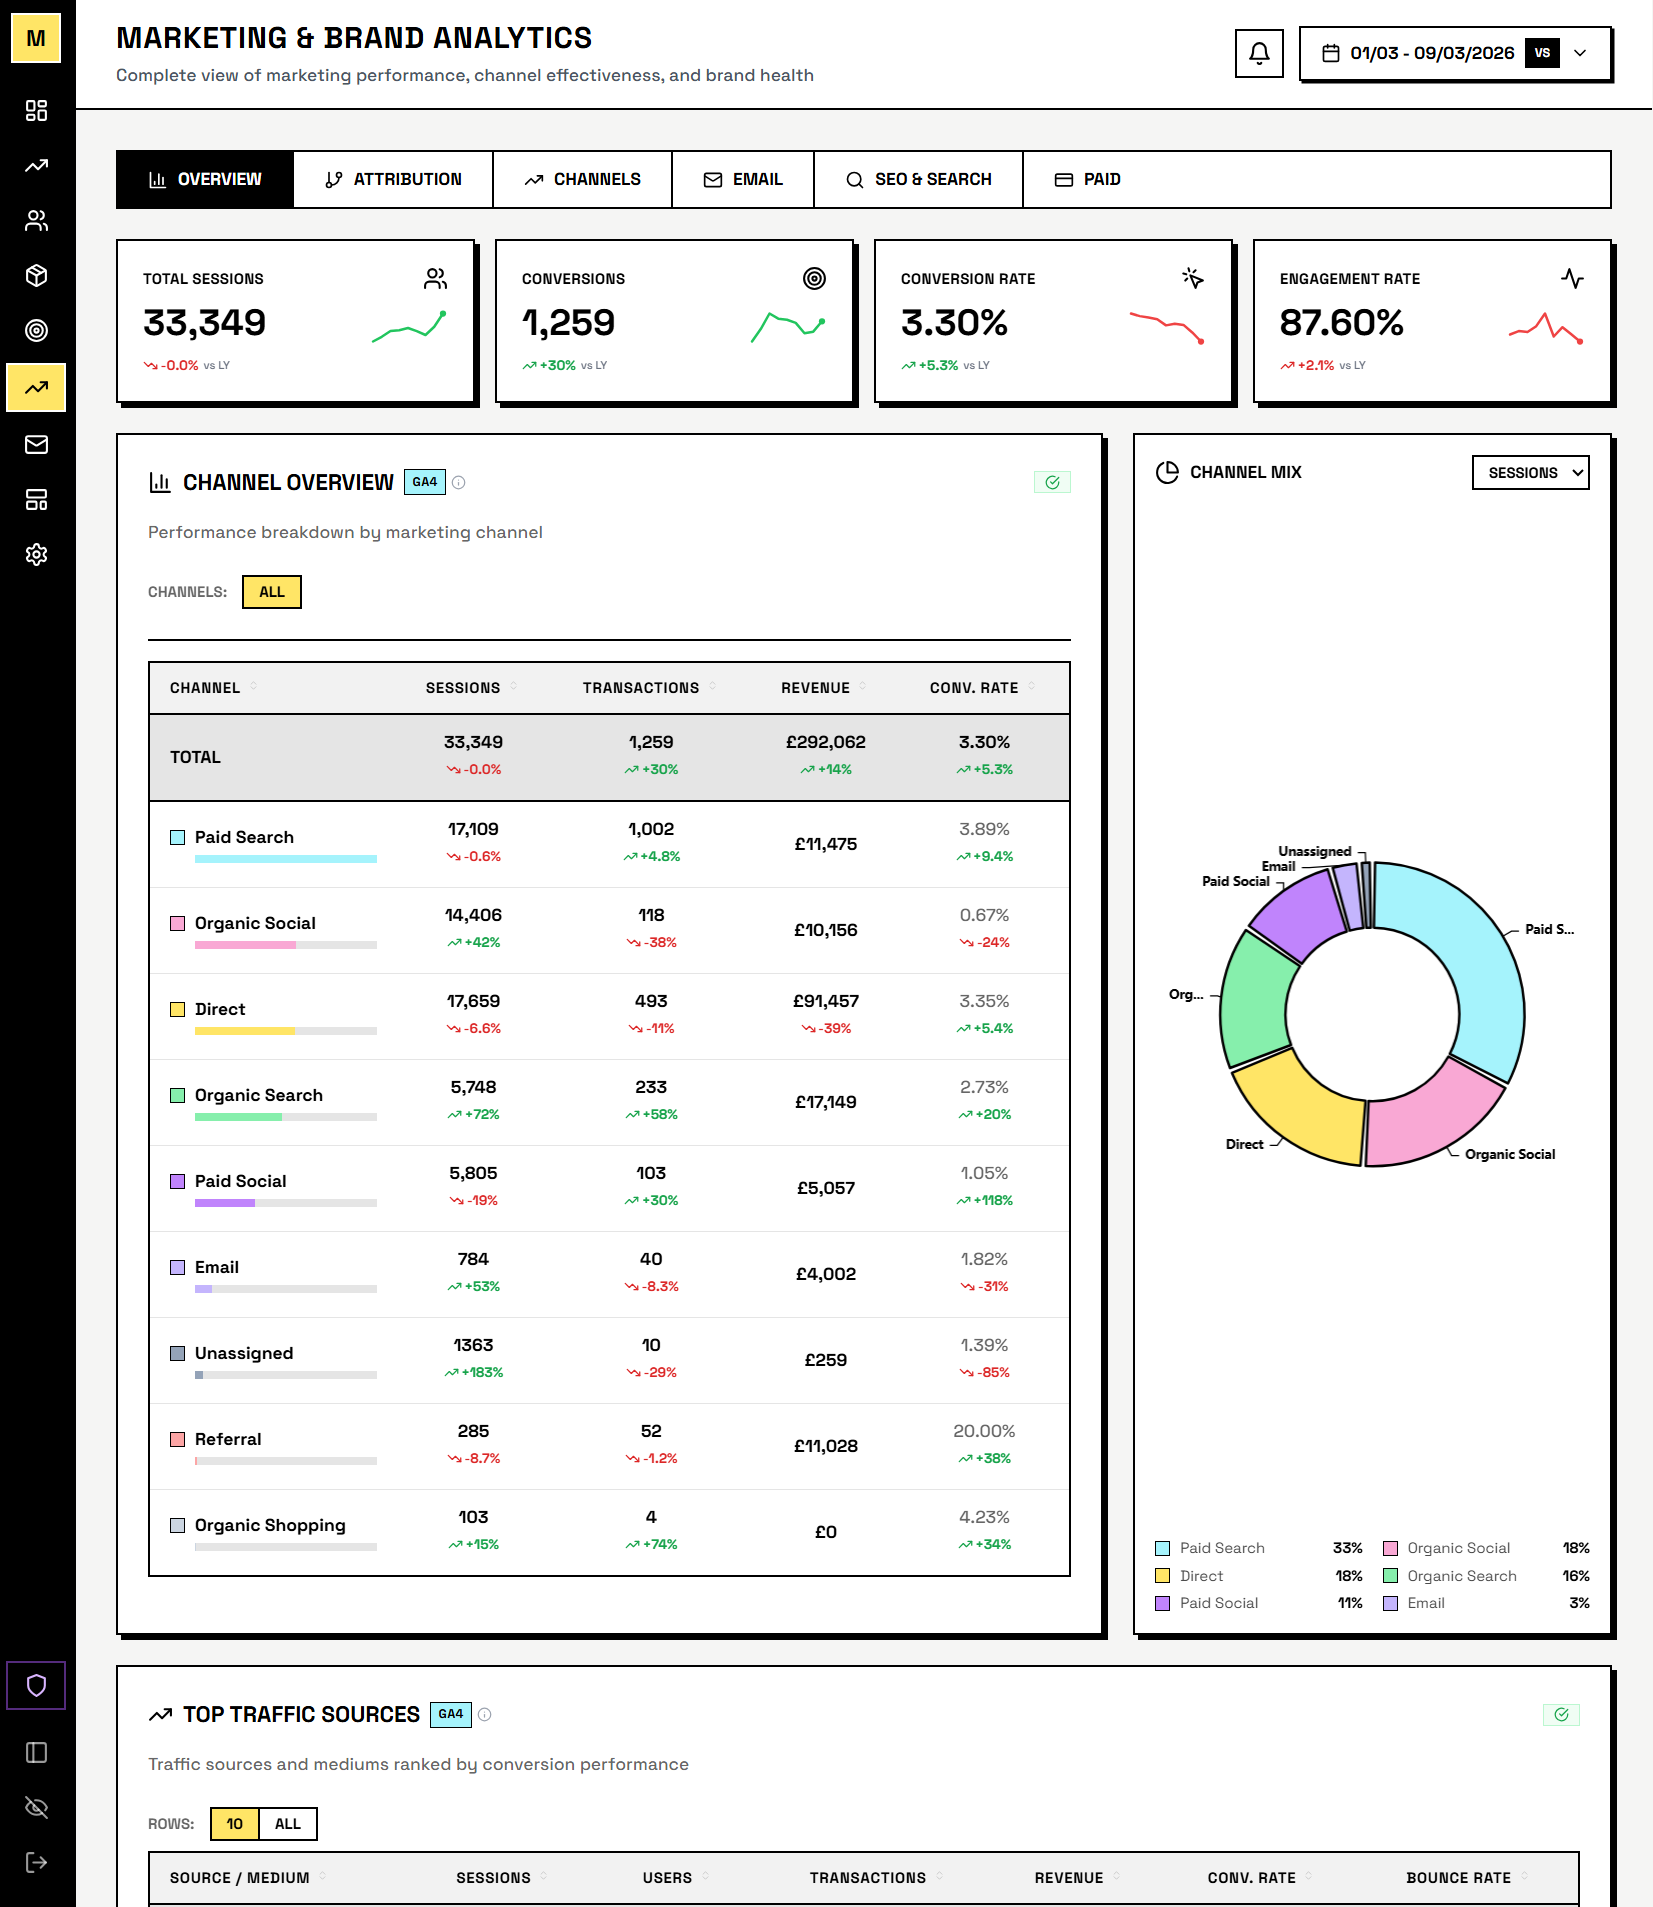
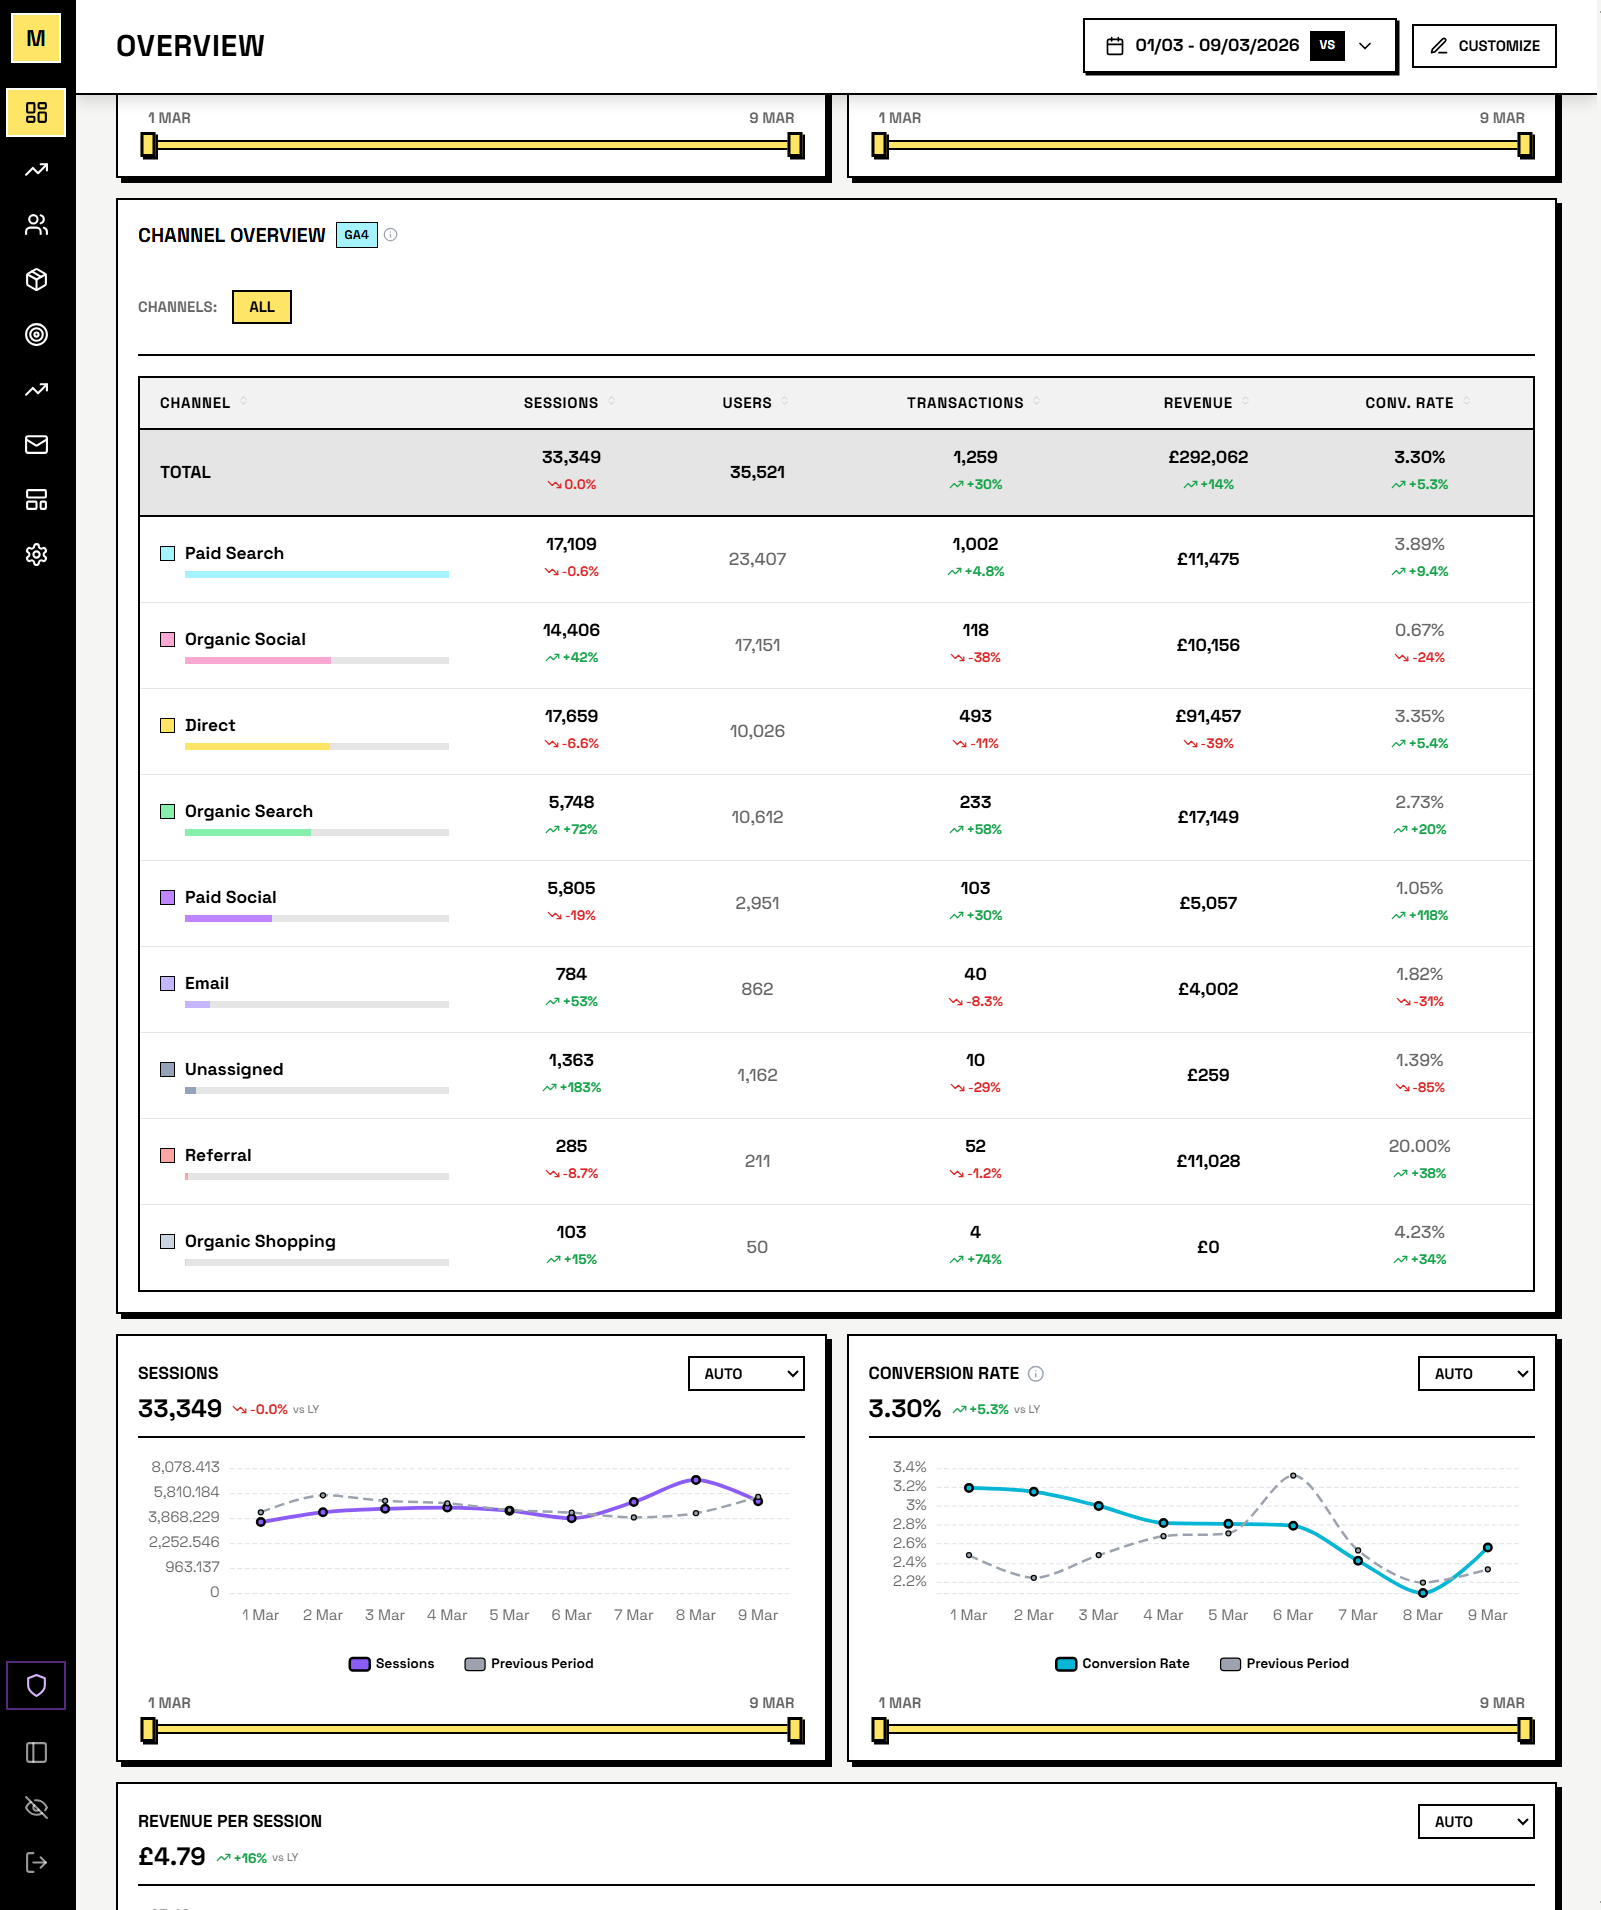
See your Shopify orders, GA4 sessions, Klaviyo campaigns, and Google Ads performance in one view. No more switching between four different tabs to understand how your store is performing.
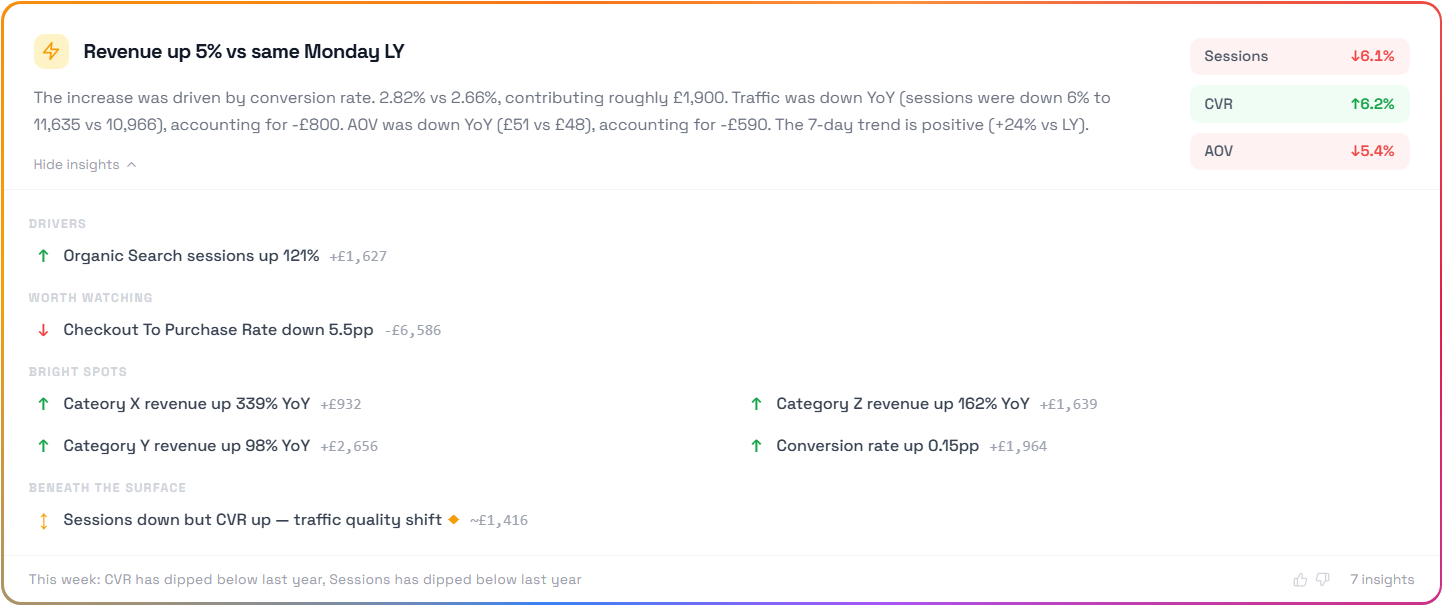
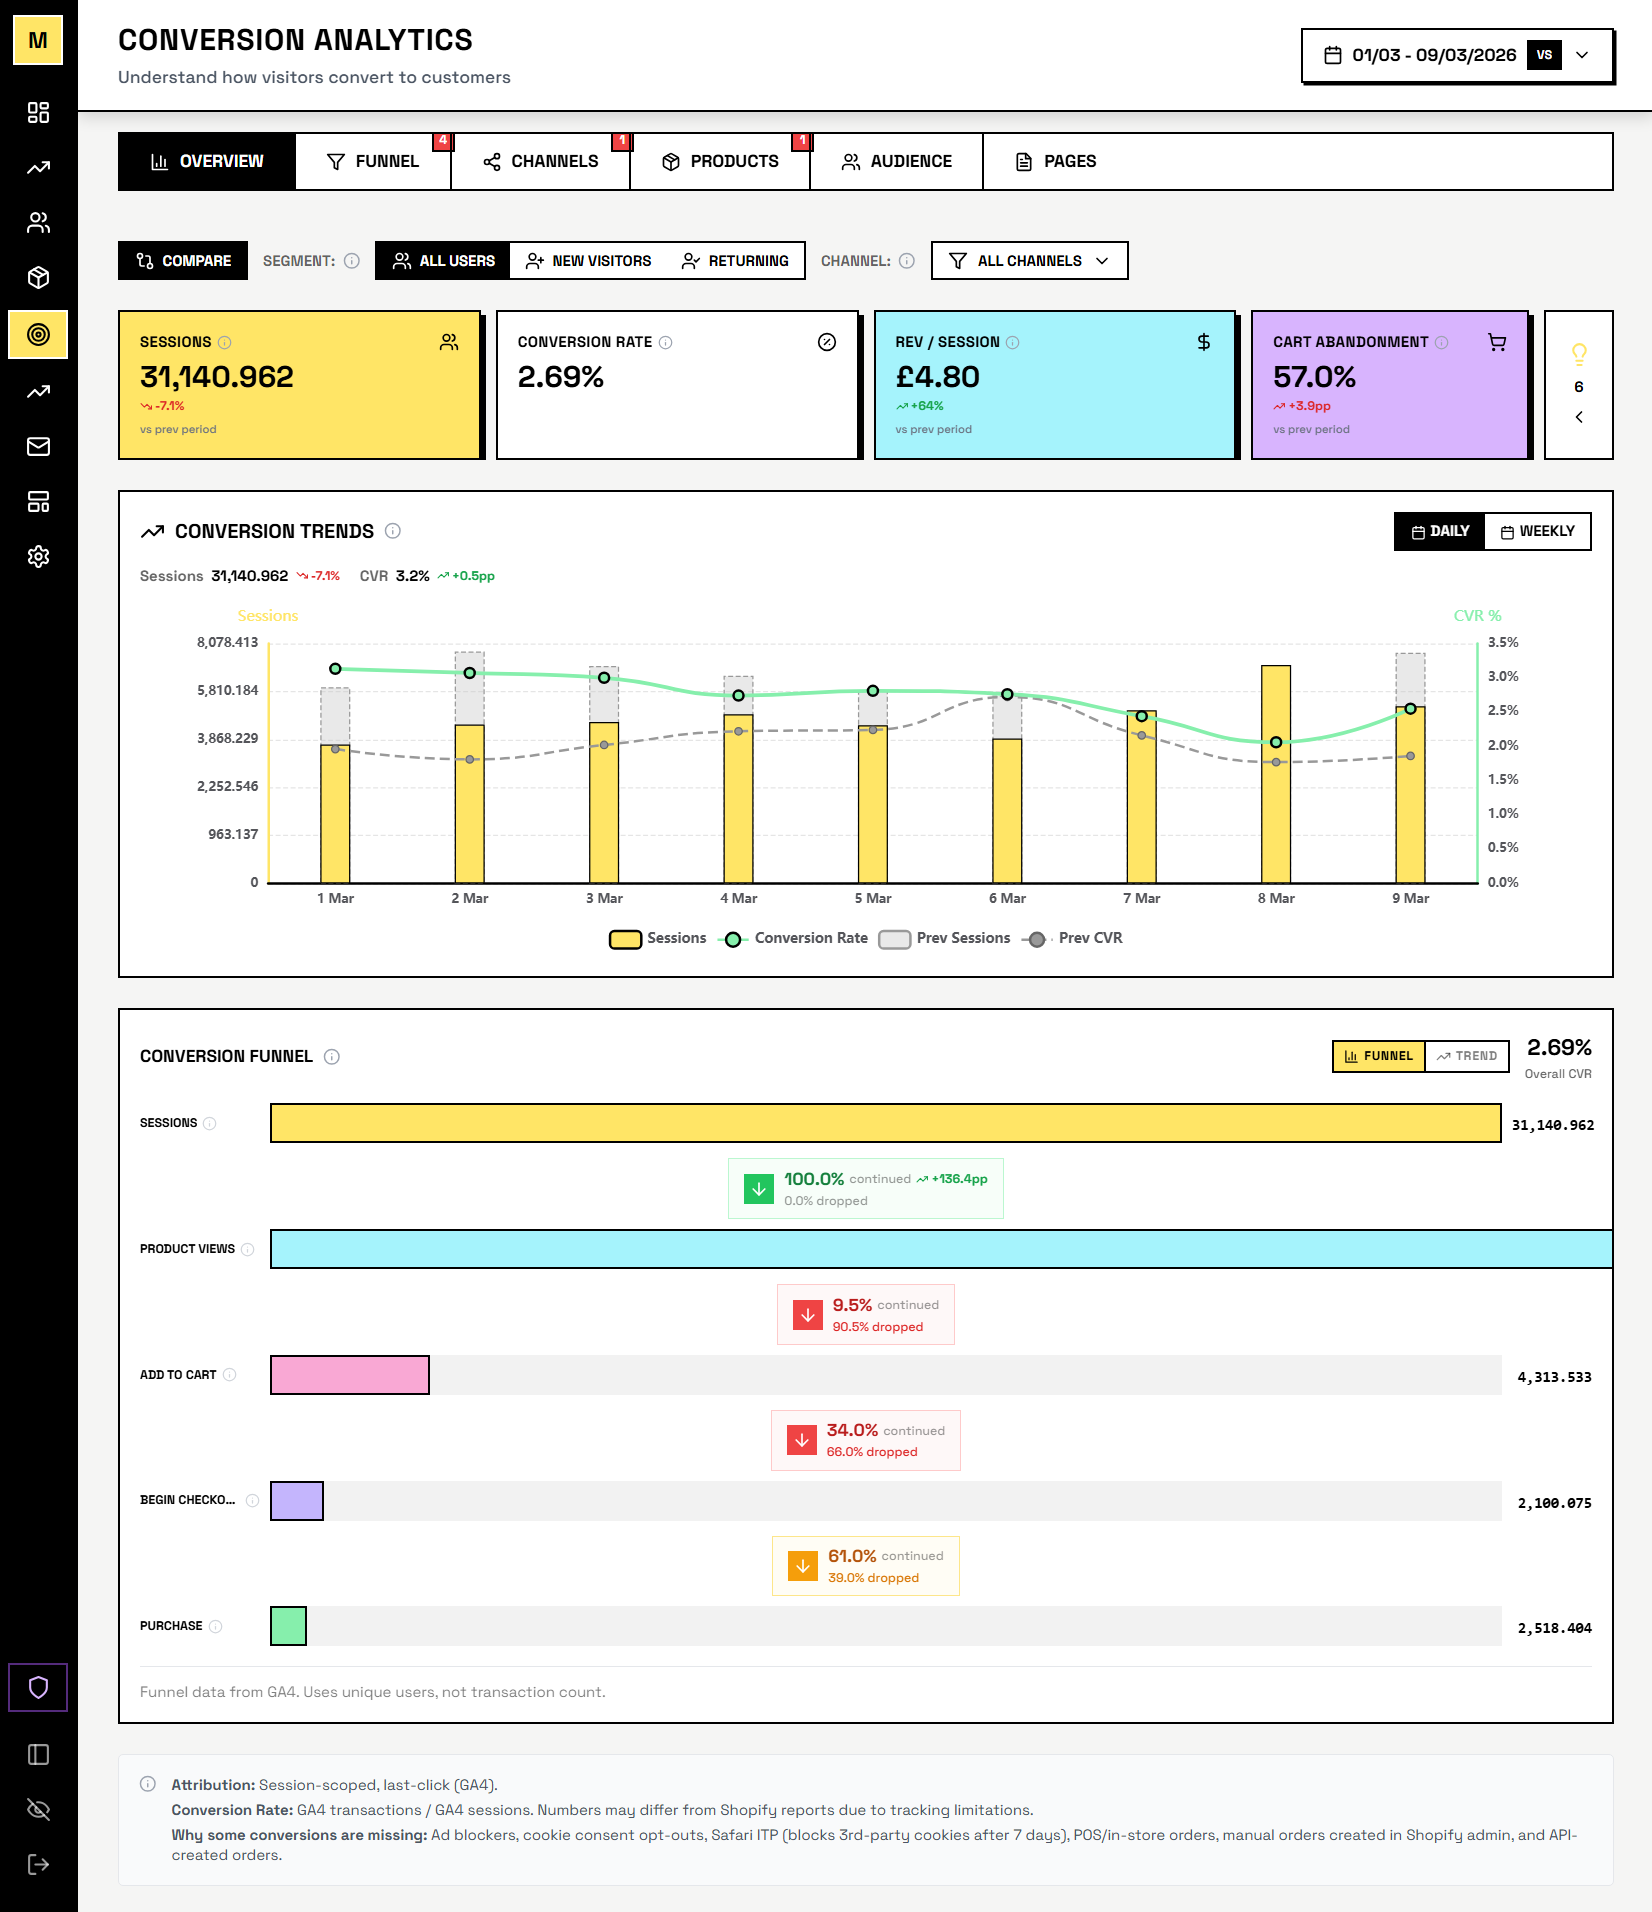
Revenue, sessions, conversion rate, and average order value are always front and centre, with detailed breakdowns available for each metric.
Compare performance across date ranges, filter by channel or device, and drill down by channel, device, or product category.
Every morning, Pulse breaks down yesterday's revenue into sessions, conversion rate, and AOV, then explains what changed. If revenue dropped because mobile conversion fell 15% while desktop held steady, Pulse tells you that - not just "revenue was down."
It also catches divergences between metrics (like orders rising while AOV falls), flags channel-level anomalies, and connects movements across your data sources - like a drop in Paid Social sessions appearing alongside a Meta Ads budget change.
Set up daily, weekly, or monthly email digests with revenue, sessions, top products, and channel breakdowns. Pick the metrics and frequency you want.
Reports go to your inbox and your team's. Useful for founders who want a morning summary, or for sharing performance with stakeholders who don't log in.
Your Shopify products are automatically grouped by type. Each category gets revenue, units sold, order count, AOV, and return rates.
Track which categories are growing and which are shrinking. See revenue share per category and how it shifts month to month.
See exactly where your traffic and revenue come from. Mocha Analytics combines GA4 channel groupings with UTM tracking from a checkout pixel for accurate last-touch attribution.
Track organic search, paid search, paid social, email, direct, and referral channels side by side. Compare session share against revenue share to identify which channels convert best and where to invest your marketing budget.
The attribution pixel captures UTM parameters and click IDs at checkout, matching them back to orders for accurate last-touch attribution beyond what GA4 provides out of the box.
GA4 sessions divided by Shopify orders, broken down by channel and device. Not GA4's ecommerce conversion rate - actual orders from actual sessions.
Visualise your conversion funnel from sessions to orders, compare rates across traffic sources, and spot device-level drop-offs. Track how conversion rate and average order value move together over time to understand what drove your revenue.
Year-over-year overlays and trend lines make it easy to separate real shifts from seasonal patterns, so you can measure the impact of site changes and optimisation efforts.
New vs returning breakdowns, acquisition trends, and repeat purchase frequency. Track how your customer mix shifts over time.
Shopify customer data is matched with GA4 sessions so you can see which channels acquired which customers. First-order rates by month, segment breakdowns, and lifetime value per acquisition source.
Mocha Analytics is in closed beta. Request access to get started.
Mocha Analytics is currently in closed beta. Enter your email and we'll be in touch.